Execution activity and audit
README · Console tour · API · Operations
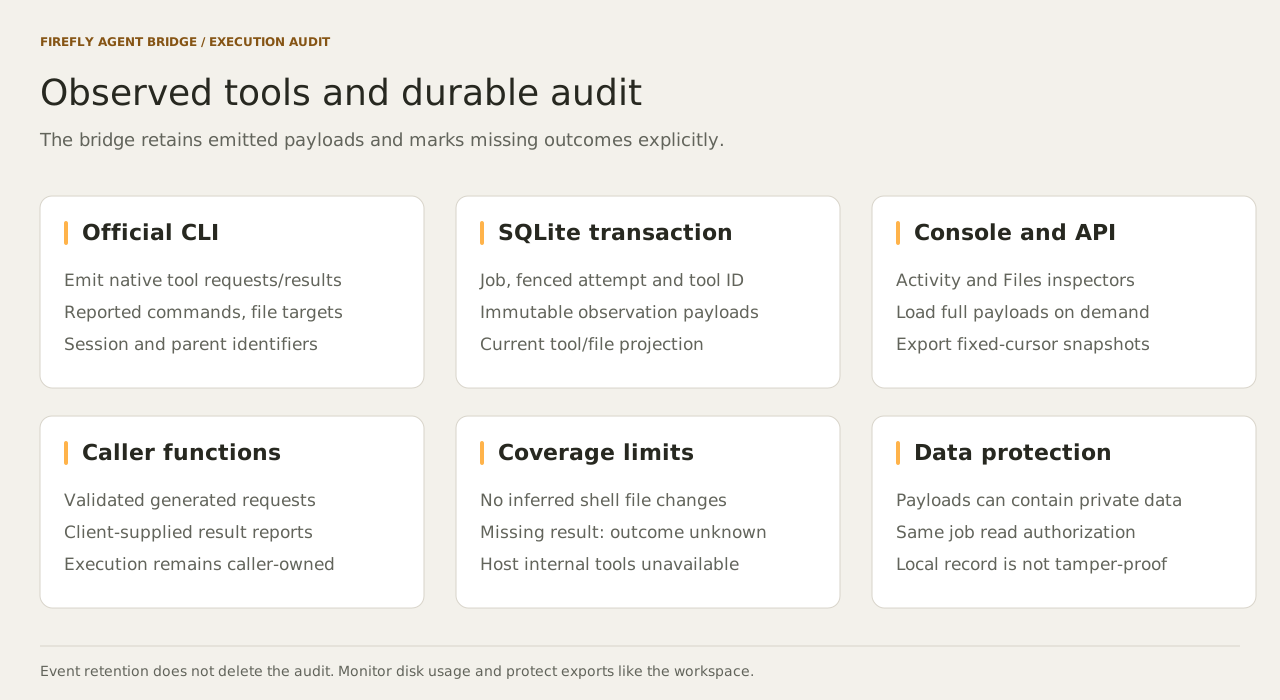
The selected official CLI supplies observations for native jobs. A job can expose its tool calls, file targets, commands, and complete emitted inputs/results. Select the job, then open Activity or Files. Workflow steps use the same views through Open step.
Inspect what happened
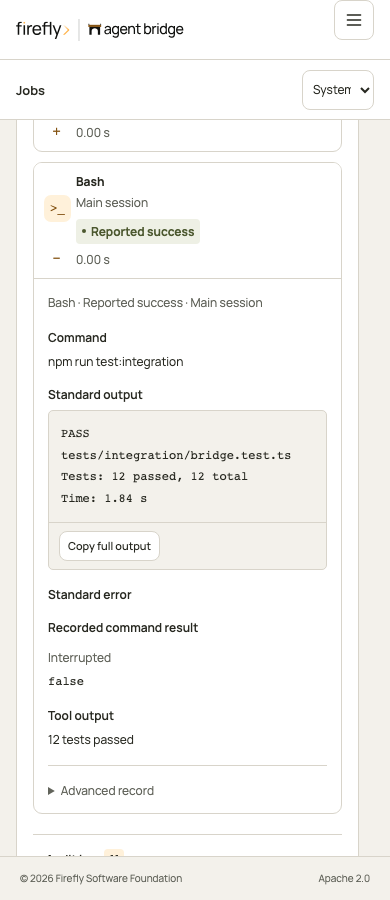
Activity lists native tools in observation order. Expand a card to read its command, output, supplied content, and result. Bash cards show the command and stdout/stderr when Claude supplies those fields. Advanced record exposes the complete captured payload, native tool ID, bridge attempt ID, session ID, parent tool ID, timestamps, and observed duration.
If Claude groups several tool results in one message, the outer structured result is labeled Shared message result, not attributed to each tool. It is stored on the first result as output.sharedMessageResult, with the participating toolIds; the others use output.sharedMessageResultToolId to reference that tool within the same job and attempt. Inspectors resolve that reference on demand. Audit exports preserve the shared payload and references without multiplying storage for each result.
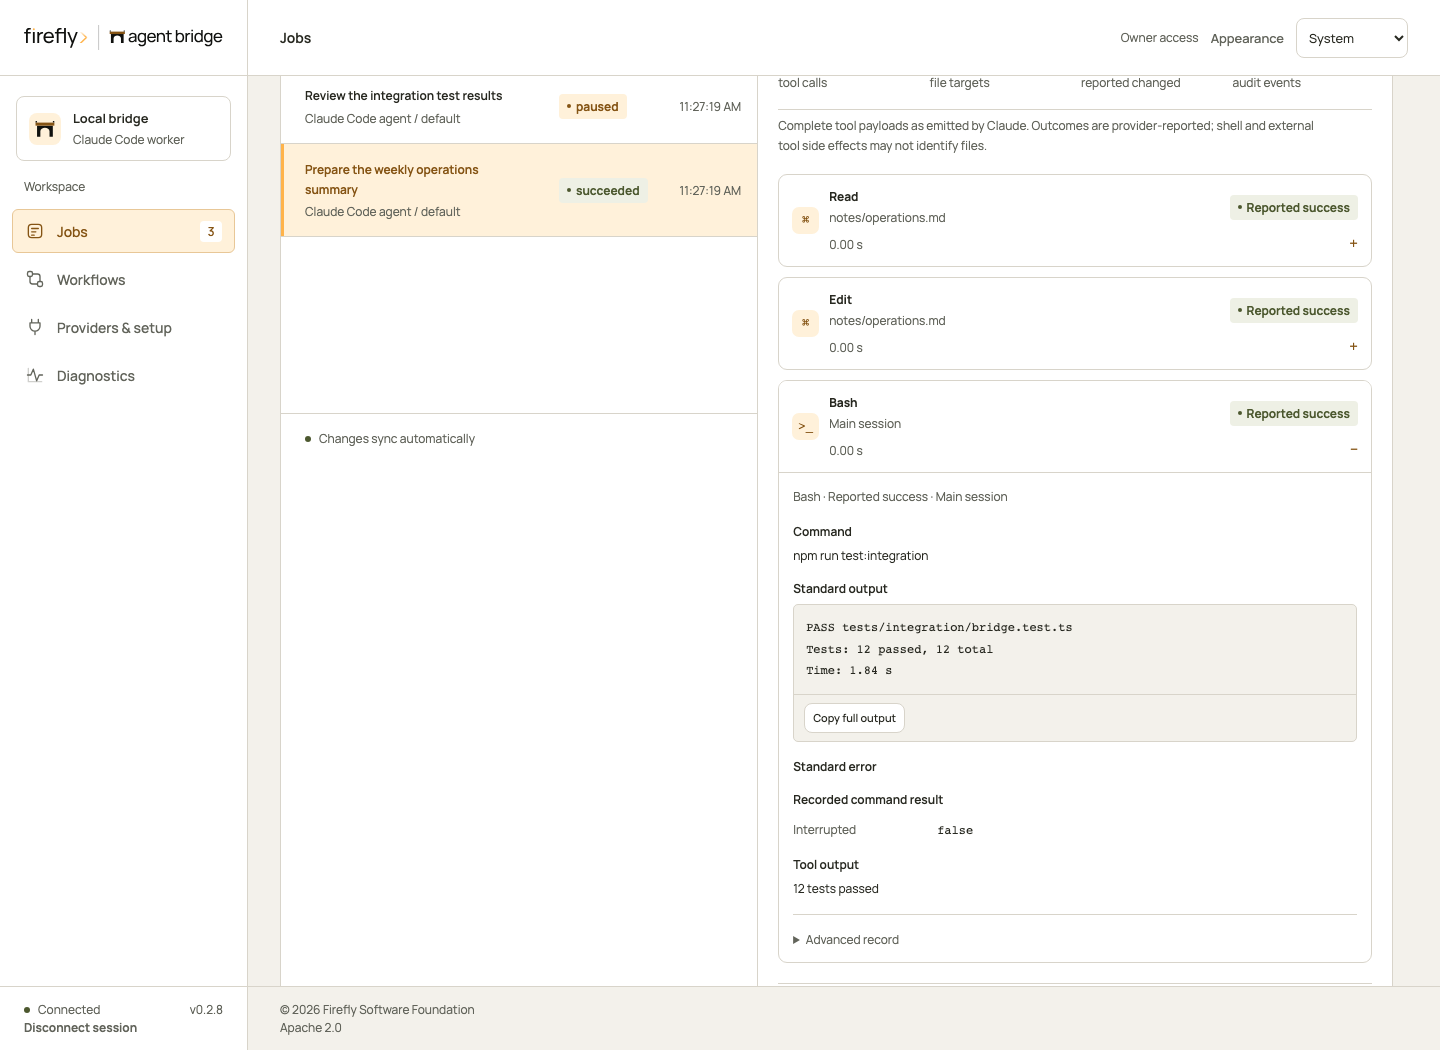
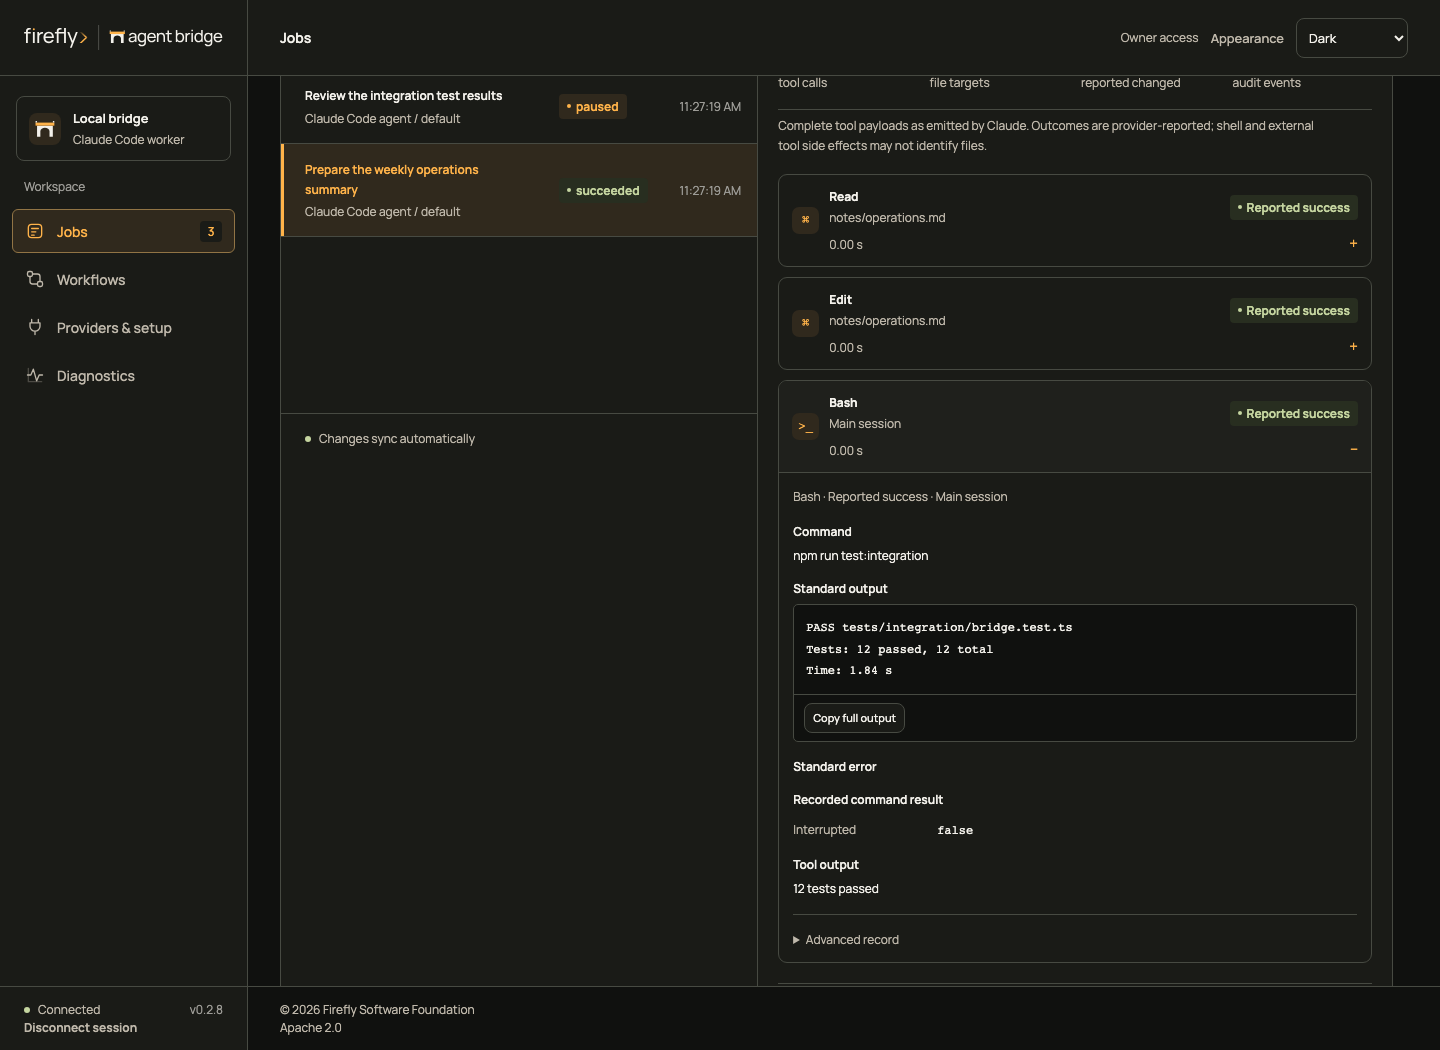
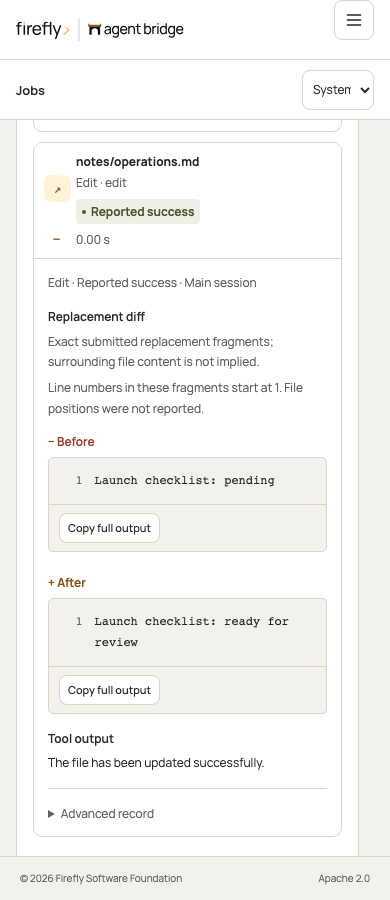
Files lists individual Read, Write, Edit, and NotebookEdit actions with a reported target. Read exposes returned content; Write exposes submitted content. Edit displays the exact before/after replacement fragments. Structured patches and an original file are also displayed when Claude emits them. A fragment comparison is labeled Replacement diff: it is not presented as a complete repository diff. The same path can appear several times as a job reads and edits it.
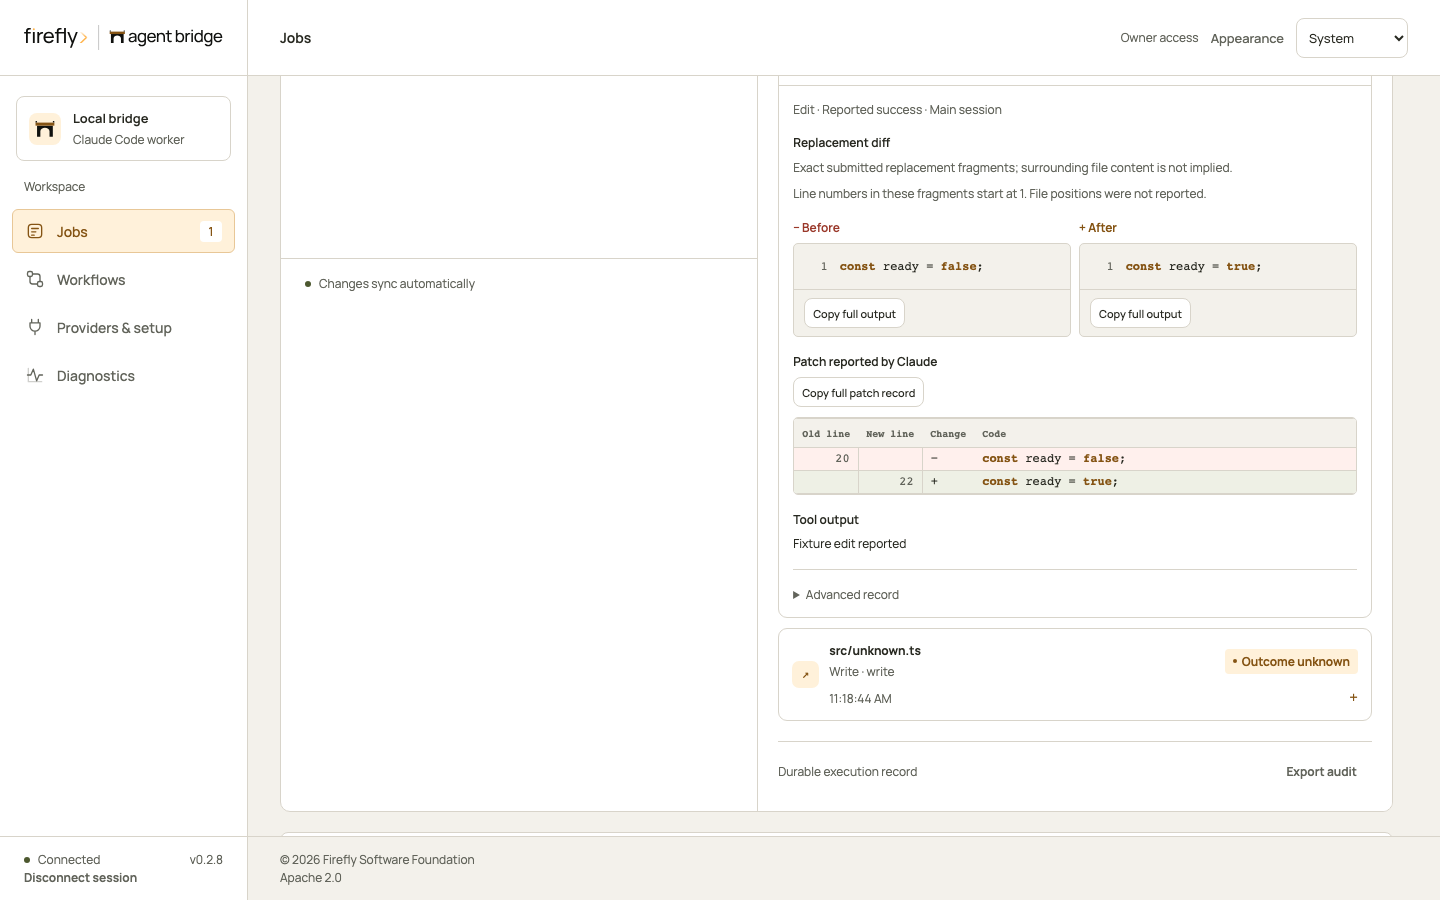
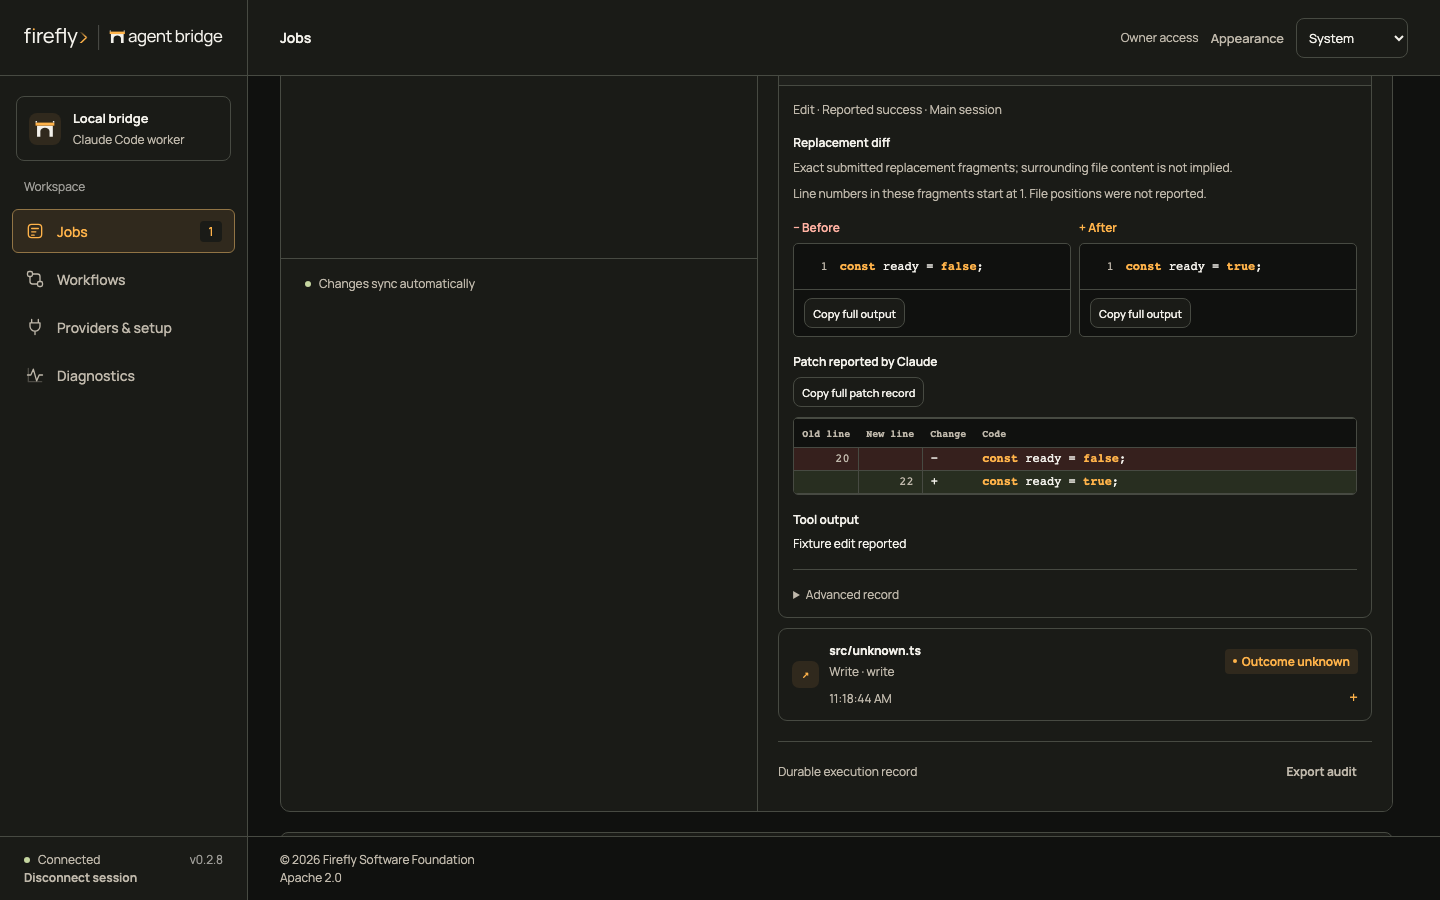
The counters count distinct reported path strings, native tool calls, distinct paths with a successful Write/Edit result, and persisted observations. Paths are kept as emitted, so relative and absolute spellings of one file can count separately. Times measure observation receipt at the bridge, not exact operating-system execution time. Out-of-order observations may have no duration.
| Outcome | What the bridge observed |
|---|---|
| Awaiting result | A tool request arrived; no terminal result has arrived. |
| Reported success | Claude returned a tool result without an error flag. |
| Reported failure | Claude returned a tool result with is_error: true. |
| Outcome unknown | The attempt ended or ownership was lost before a terminal result arrived. |
A failed or unknown action may already have produced effects. Pausing, cancellation, timeout, and crash recovery do not undo filesystem changes. Resume and retry retain earlier observations under their original attempts; replayed messages within an attempt do not create duplicate tool records. Subagent tool messages retain the reported parent tool ID without replacing the main job's resumable session.
Execution ownership and coverage
- Native agent jobs capture emitted Codex or Claude tool observations. Claude's streamed tool requests/results include its native tool identifiers. Known built-in file tools provide target paths. Bash, network tools, and external commands have complete emitted payloads, but their indirect file effects are not inferred from command text.
- In OpenAI inference, the application executes functions. Generated requests are recorded as
client.tool_requested. Function requests and results supplied on a subsequent request are recorded asclient.tool_request_reportedandclient.tool_result_reportedin that new job. These are client reports, not bridge-verified execution. Use the stable tool-call ID to correlate turns. - Host conversation jobs receive progress and completion reports through MCP. The bridge cannot observe that conversation's internal tools or filesystem effects.
Only information emitted to the owned CLI process is available. Claude may shorten large tool outputs, omit subprocess internals, or report only part of a file. The bridge preserves the input/result payloads it receives without an additional audit preview truncation. The profile's maxOutputBytes still bounds the entire native stdout stream; exceeding it fails the attempt and leaves unfinished tools unknown. The audit does not scan arbitrary files, read private host transcripts, or infer missing content.
Durable history and access
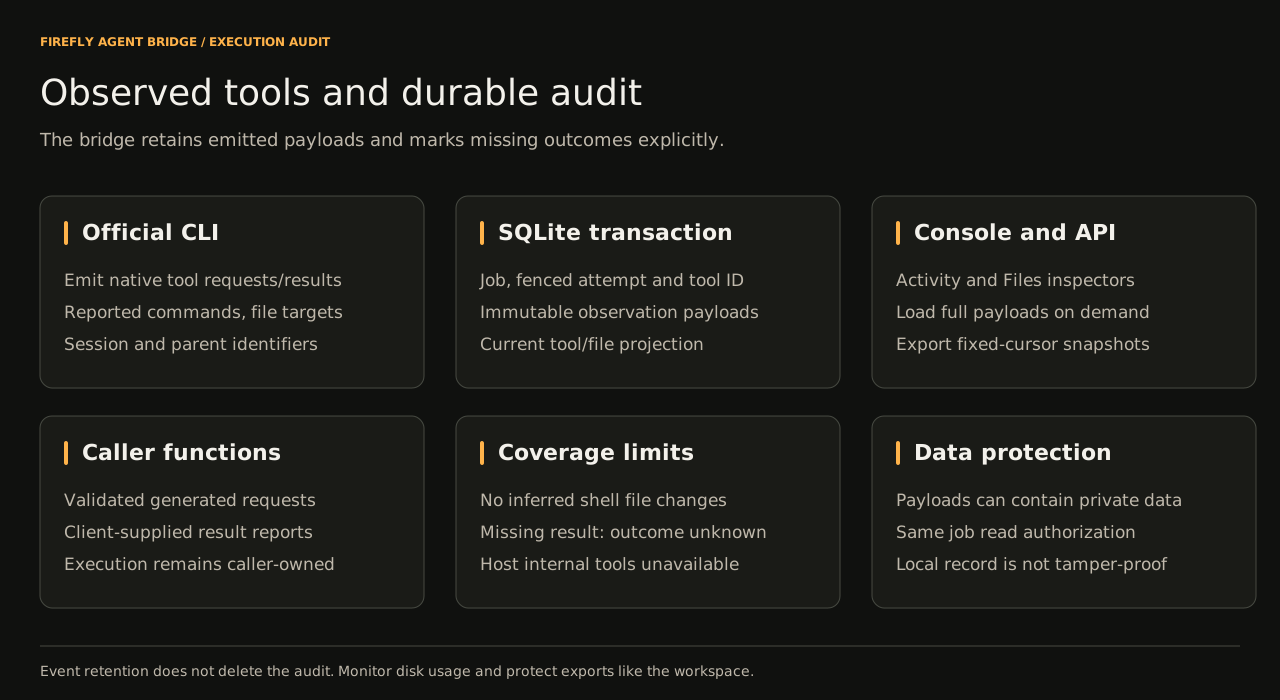
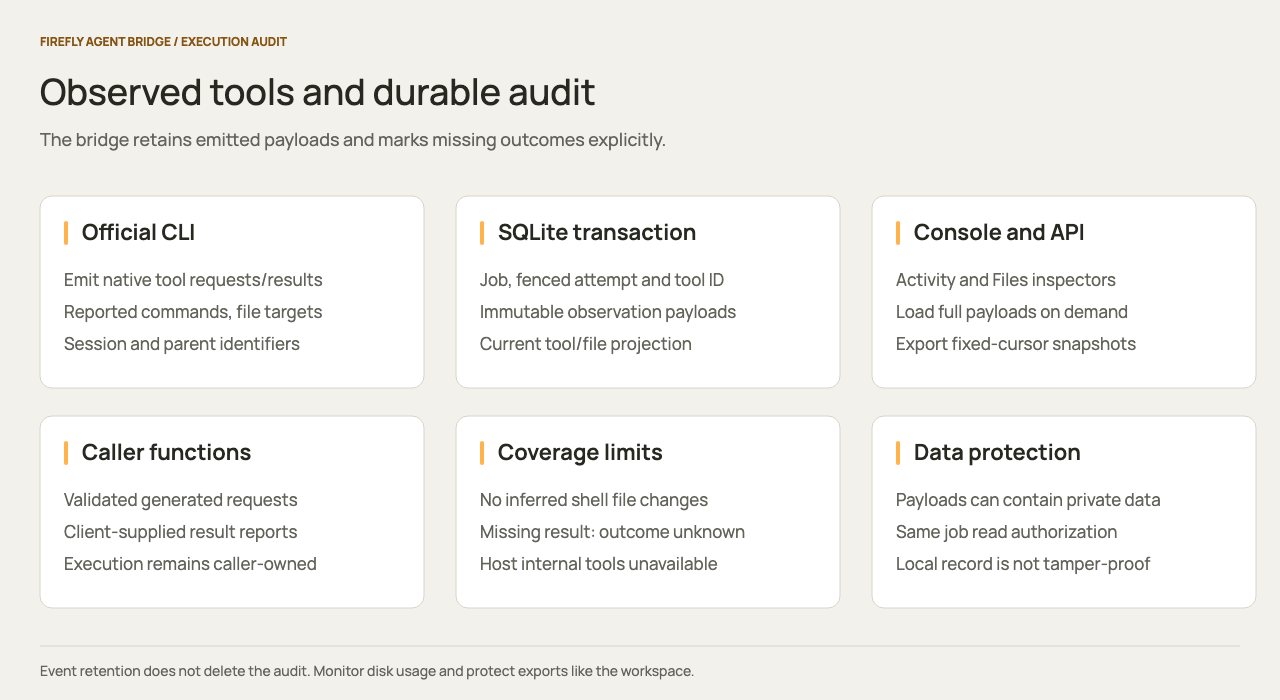
SQLite retains an append-only observation history and a current tool projection, written in the same transaction as queue state. The audit includes job lifecycle, session, compaction, rate-limit, and child-task observations. Tool payloads are committed before a metadata-only job.tool SSE notification is published. Other existing progress events can contain assistant text.
SSE retains approximately 10,000 recent events; pruning that notification window does not delete the audit. Tool observations and payloads remain until the local database is deliberately archived or removed. There is no automatic audit cleanup or retroactive reconstruction of information the bridge did not observe. Monitor disk usage and follow the backup procedure.
Complete payloads may include source code, credentials printed by a command, and private file contents. The audit deliberately preserves them. The same job ownership and read scope protect metadata, payloads, and exports; an owner can read all jobs. No token appears in a download URL. List responses and tool SSE notifications omit raw payloads; expanded inspectors load them through authenticated requests. Treat exports and backups with the same care as the workspace.
This is a local operational audit, not a tamper-proof compliance ledger: the operating-system user can edit the database. A successful tool result is not independent proof of the current filesystem state.
Export or integrate
Export audit downloads a JSON snapshot with schemaVersion, jobId, exportedAt, through, and entries. It includes complete captured tool inputs/results. An export fixes through to the first page's highest audit ID so new observations cannot change that snapshot. The browser permits up to 64 MB and fails visibly rather than downloading a partial export.
For larger audits, use the streaming-to-disk Node.js export example:
export BRIDGE_URL="http://127.0.0.1:8766"
# Set BRIDGE_TOKEN using the token guide; never put it in a URL.
export JOB_ID="your-job-uuid"
node examples/export-audit.mjs ./execution-audit.json
The example creates a new private file, pages until completion, retries rate-limited reads, and removes its own incomplete output on failure. It never overwrites an existing export. See getting a bridge token.
| Endpoint | Response |
|---|---|
GET /v1/bridge/jobs/{id}/audit |
Immutable observation entries, current summary, through, and nextCursor. |
GET /v1/bridge/jobs/{id}/tools |
Native tool metadata and nextCursor; no raw inputs/results. |
GET /v1/bridge/jobs/{id}/tools/{tool} |
One complete tool observation, including input/output; tool is the numeric bridge record ID. |
Both lists accept after (numeric, default 0) and limit (1 to 200, default 100). Audit accepts through and includePayloads=true; tools accepts filesOnly=true. Audit pages also stop around 4 MB, always returning at least one whole record. Always follow nextCursor until it is null, even when a page has fewer entries than limit. summary describes current state and is not part of the immutable export snapshot. Tool projections are live; use audit entries for historical state.
curl --fail-with-body "$BRIDGE_URL/v1/bridge/jobs/$JOB_ID/audit?limit=100&includePayloads=true" \
  -H "Authorization: Bearer $BRIDGE_TOKEN"
Mobile tool inspector · Mobile file diff
The protocol interpretation follows Anthropic's programmatic CLI and subagent message correlation documentation.
Investigate an interrupted action
Start with the affected job ID and a token with read for its owning principal. The local owner can inspect jobs from every principal. Keep an audit export private before attempting recovery when its contents are needed for investigation.
- Read the job and its attempts to identify the execution mode, failed attempt, native session and terminal error. Workflow runs link to the job that performed each step.
- Read tool metadata and expand the affected record. Correlate its attempt ID and native tool ID with the command, file path and emitted result. In the API, use the numeric bridge record ID from the tools list to retrieve its full payload.
- Inspect the actual workspace or external service when a result is missing. A submitted Write payload and an Edit replacement fragment describe requested content; they cannot establish the current contents of a file after later actions.
- Choose the next action from the observed state. Resume preserves an available native session; retry starts a new session and can repeat earlier effects. Image jobs require a new explicit completion request after interruption. Recovery and troubleshooting describe these controls.
- Keep the old attempt and export with the new outcome. Audit pagination uses a fixed
throughboundary, while tool projections and summaries describe current state.
For API-only inspection, read GET /v1/bridge/jobs/{id}, /attempts, /tools and /tools/{tool} before exporting /audit. These calls do not run a tool or change the job. A 404 can mean the job belongs to another principal; a 403 requires the correct scope or profile assignment. Correct access through the token guide, then continue with the same job ID.