Export metrics and traces
Use this page to send Weave's metrics and traces to an OpenTelemetry collector and to read what arrives. It is written for operators. You need a running Weave API that you start yourself (from the standalone walkthrough or a deployment) and a collector that accepts OTLP over HTTP/protobuf. Setting it up takes about 15 minutes.
Export is off by default, and only WEAVE_TELEMETRY turns it on. Weave owns
its OpenTelemetry providers inside each API process. Starting the compiler,
using the SDK, or setting the usual OTEL_EXPORTER_* variables does not enable
Weave exports, and no provider is registered as a process global.
The local platform does not export telemetry. weave platform start
ignores WEAVE_* variables from your shell, so it never receives
WEAVE_TELEMETRY; see configuration.
Use the standalone walkthrough or a deployment to try export.
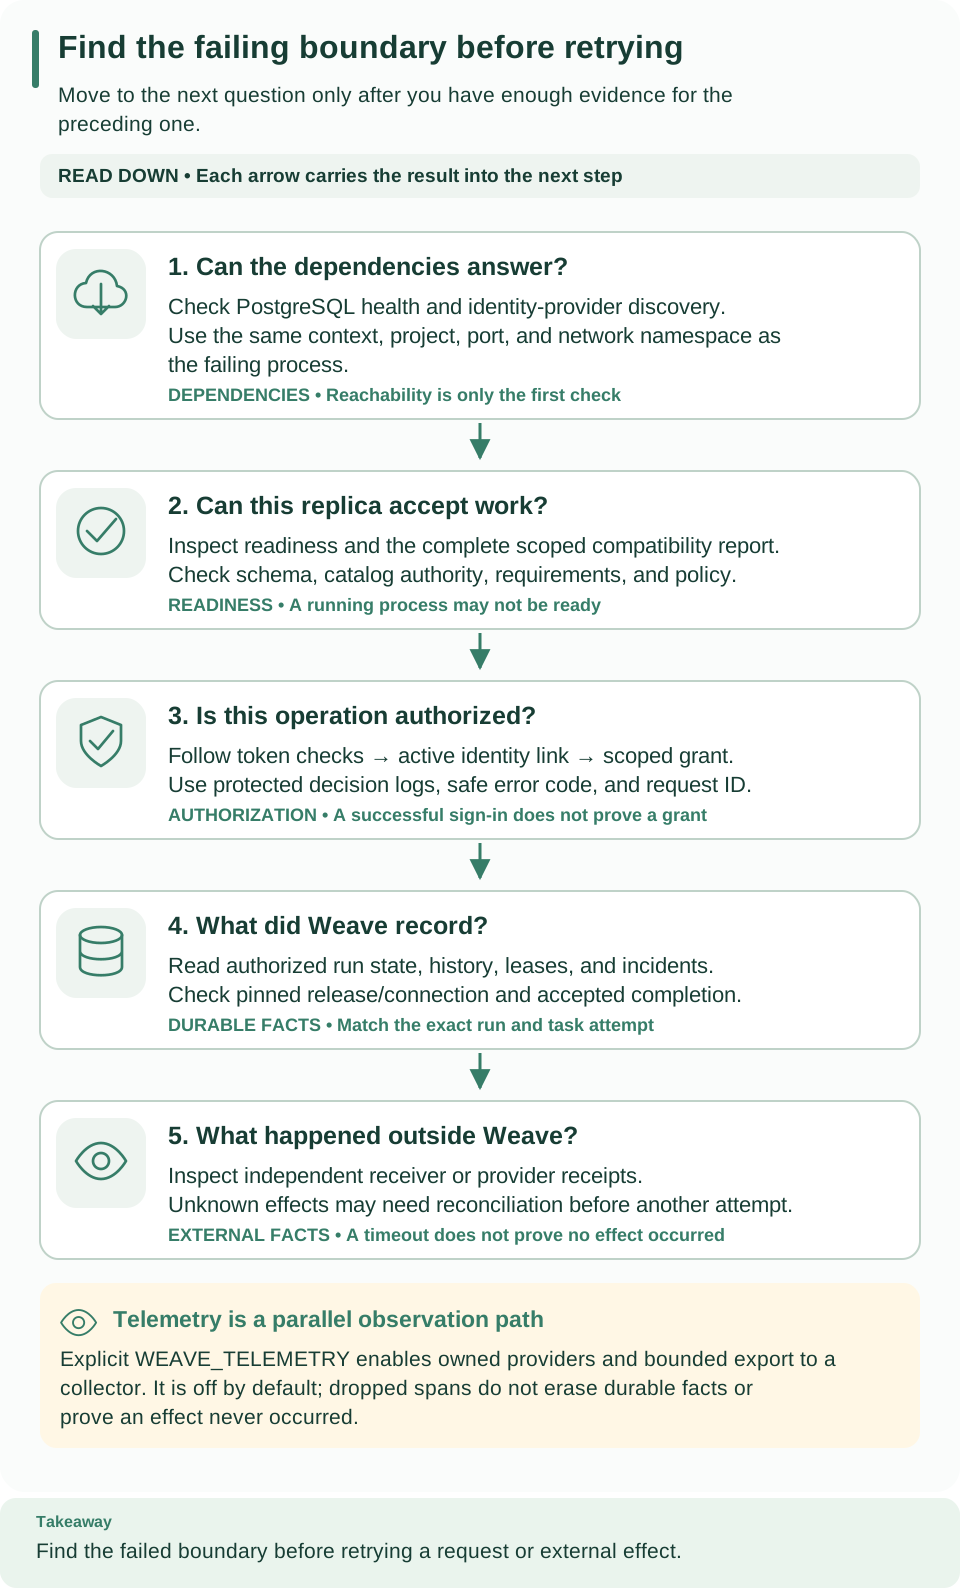
Read the five cards from top to bottom: dependencies, readiness, authorization, what Weave recorded, and what happened outside Weave. The cream box below them is telemetry: a parallel channel of observations. Use the stored run and independent receipts to establish an outcome, even when export is incomplete.
Choose the evidence you need
| Question | Start here | What it can establish |
|---|---|---|
| Is this replica's compatibility monitor still progressing? | /health/live |
The monitor is running and has completed a scan within its allowed time |
| Can this replica accept work? | /health/ready and the scoped compatibility report |
Runtime readiness and blocking requirements |
| How is the service behaving over time? | Collector metrics and traces | Bounded operational observations, subject to export loss |
| Did a run or effect complete? | Authorized run history and receiver or provider receipts | Durable recorded outcome and external acceptance evidence |
| Why was access allowed or denied? | Protected authorization logs and access audit | Authorization decision context, subject to configured log retention |
Metrics and traces complement the stored execution history. They help with trends, queue age, and failure investigation, but a missing span does not prove that an operation never happened. See local runtime for authorization logging and history and replay for run evidence.
Read liveness and readiness together
Configure your container platform's liveness probe against /health/live and
its readiness probe against /health/ready. They answer different operational
questions:
| Liveness | Readiness | What to do |
|---|---|---|
| HTTP 200 | HTTP 200 | The monitor is progressing and this replica can accept work. |
| HTTP 200 | HTTP 503 | The monitor is progressing but found a blocking requirement. Inspect the scoped compatibility report and resolve that requirement. |
| HTTP 503 | HTTP 503 | The monitor stopped or has not completed its work within the allowed time. The container platform can replace the unhealthy process according to its probe policy. |
The completion allowance includes the scan interval, database scan and cleanup, and the configured time needed to shut down or initialize runtime effects. A scan counts as completed only after its callbacks finish. This prevents a stuck callback from indefinitely reporting a live replica. The watchdog does not start a second set of runtime effects inside the same process.
After a replacement, verify that readiness returns to HTTP 200 and the
compatibility report's checked_at advances. Inspect affected runs and external
receipts before retrying uncertain work; a process restart alone does not
establish whether an external action finished.
Enable export to a collector
The repository's Compose files do not start a collector; bring your own and confirm that its OTLP HTTP/protobuf receiver is enabled. The example assumes it listens on the API host's loopback port 4318.
1. Write the configuration
WEAVE_TELEMETRY is one JSON object. Weave never appends paths or discovers a
collector, so give the exact signal URLs:
# Send traces and metrics to a collector on the same host as the API.
export WEAVE_TELEMETRY='{"enabled":true,"traces_endpoint":"http://127.0.0.1:4318/v1/traces","metrics_endpoint":"http://127.0.0.1:4318/v1/metrics","timeout_seconds":5,"metrics_interval_seconds":30}'
Expected: no output. Set the variable in the shell that starts the API (in the
standalone walkthrough, terminal 2 after you stop the API with Ctrl-C), or in the
API's protected environment configuration for a managed deployment. An export
in another terminal does not change an API that is already running, in that
terminal or in a container.
2. Restart the API
Start the API with its normal startup command. Expected: the API starts and
/health/ready answers HTTP 200. An invalid value stops startup with
Invalid WEAVE_TELEMETRY configuration.
3. Generate traffic and check the collector
Run an authorized request, for example reading the first run through the CLI.
Wait at least metrics_interval_seconds (30 seconds here) before you look for
metrics. Expected: the collector shows data with the resource
service.name=firefly-weave, the instrumentation scope firefly.weave, and the
fixed weave.* metric and span names listed in
What is exported.
4. Check that export actually arrived
A ready API is not proof that the collector received data. Check both sides independently:
- Confirm that the collector sees traffic from the correct API process or container. Check its OTLP receiver status separately from any dashboard.
- Find the service resource and the instrumentation scope above. Filter by a
fixed
operationorstatusattribute; there is no run ID label. - Compare the request you made with the matching operation observation. For a workflow transition, also confirm the run's durable state through the API.
- If nothing arrives, use the troubleshooting table before you increase logging. Export is best effort and never retries a failed request.
Export failure never changes workflow state or grants execution authority.
Configuration fields
| Field | Default | Rule |
|---|---|---|
enabled |
false |
JSON true or false; at least one endpoint is required when true |
traces_endpoint, metrics_endpoint |
Absent | Exact http or https URL, at most 2048 characters; http only for localhost, 127.0.0.1, or ::1; no user name, password, query, or fragment. Either may be omitted |
authorization |
Absent | The complete Authorization header value the collector expects, 1 to 4096 printable ASCII characters |
timeout_seconds |
5 |
Greater than 0 and at most 5 |
metrics_interval_seconds |
30 |
From 5 to 300 |
The whole value may be at most 32 KiB, and unknown fields are rejected.
Loopback means the API's own host or container. The example works when the
collector runs on the same host as an API started in a shell. Inside a container,
127.0.0.1 is that container. For any other topology, use explicit HTTPS
collector URLs.
Keep the collector credential private. Supply authorization through a
protected deployment secret or environment file, never a command argument,
source file, URL, or workflow definition, and never print the configuration.
Ambient OTLP headers, proxy settings, resource detectors, and credential-provider
hooks are not used by Weave's exporters.
What is exported
Every instrument has a fixed name. Durations and queue age are histograms in seconds.
| Type | Instruments |
|---|---|
| Counters | weave.requests, weave.transitions, weave.recoveries, weave.provider_events, weave.outbox_deliveries, weave.secret_capacity, weave.compatibility, weave.retention, weave.telemetry_dropped, weave.queue_unknown |
| Histograms | weave.duration, weave.queue_age |
| Gauges | weave.inventory, weave.inventory_freshness |
Only three attributes. Metrics carry operation, status, and
error_code. Operations come from the public operation manifest plus a few fixed
internal names; statuses and error codes come from short allowlists, and any
other value becomes other. Tenant, principal, workflow, run, task, connection,
source, and message identifiers are never labels. Request paths, queries, phone
numbers, payloads, credentials, and exception messages are excluded.
Bounded series. Each instrument keeps at most 256 attribute combinations;
further combinations are added to a fixed other series.
How to read inventory. Queued work whose legacy enqueue time is unknown is
counted in weave.queue_unknown instead of being given the migration time. An
incomplete inventory sweep does not replace the last complete weave.inventory
value. Read inventory together with weave.inventory_freshness, and use max,
not sum, when several replicas report the same global inventory.
Counts follow commits. Transition counters are queued inside the owning transaction and emitted only after it commits; a rollback discards them. A full callback buffer drops telemetry, never business state. These counters are best-effort observations; durable receipts and audit records remain the authoritative evidence.
Traces. Spans use fixed operation names and do not record exception events
or raw exception descriptions. Only a valid W3C version-00 traceparent is
propagated; baggage and tracestate are discarded. Native durable boundaries can
link up to eight validated parent contexts. Remote worker-v1 leases carry no
tracing context, so server claim and completion observations do not give
end-to-end remote-worker trace continuity.
Export limits. The trace queue holds at most 256 waiting spans and sends at
most 64 per request, from one exporter thread per enabled trace provider. A full
queue drops new spans and increases weave.telemetry_dropped; there is no retry
spool. Each export request is at most 1 MiB, uses the configured timeout (at most
five seconds), and follows no redirects; response bodies are not kept. A slow
collector therefore causes telemetry loss, not API delays. Stopping the API
closes its providers, and spans still queued may be counted as dropped instead of
delaying shutdown.
Disable or troubleshoot
To turn export off, set WEAVE_TELEMETRY='{"enabled":false}' (or remove the
variable) and restart the API. This does not disable authorization audit records
or delete workflow history. Stop only the API and collector services you own; no
volume needs to be deleted.
| What you see | Why | What to do |
|---|---|---|
| No export traffic at all | The API process never received WEAVE_TELEMETRY with "enabled": true, or it runs under weave platform start |
Restart or redeploy the API with the explicit value; OTEL_* variables are not enough |
The API stops with Invalid WEAVE_TELEMETRY configuration |
The JSON is malformed, has an unknown field, an http URL to a non-loopback host, a URL with credentials or a query, or a value out of range |
Compare each field with the table above |
| Connection refused | The collector is not listening where the API looks | A loopback URL works only for an API on the same host; use a reachable trusted URL for a container API |
| The collector rejects requests | Receiver type, exact /v1/traces or /v1/metrics path, TLS, or authorization |
Correct the receiver or the configuration; never put credentials in the URL |
| Metrics look doubled | Several replicas report the same global inventory | Use max for duplicate inventory observations and check freshness |
weave.telemetry_dropped increases |
Collector latency or queue pressure | Repair the export path; durable workflow state is never dropped with telemetry |
| A run ID is not in any label | Attributes are deliberately bounded | Inspect the run through its authorized history instead |
If exports stay absent, verify the exact endpoint, TLS trust, HTTP/protobuf support, the private authorization value, and network reachability from the API's own network namespace. Do not enable raw HTTP request logging or attach payloads to spans to diagnose a credentialed connection. Generic PyFly request logging, global tracing filters, and generic server metrics stay disabled in Weave's packaged configuration so they cannot bypass the attribute policy.
Next steps
- Look up the other server settings in configuration.
- Follow a failure from dependencies to external effects in troubleshooting.
- Inspect and resolve stuck runs with incident operations.